market microstructure · streaming systems · C++ · data visualization
lob-proc: Reconstructing Order Flow from Snapshots
A C++ snapshot parser feeding limit order book events through NATS to a browser heatmap
Exchanges publish periodic order book snapshots containing the full depth-of-book state at a point in time. lob-proc diffs consecutive snapshots to reconstruct individual order events (add, remove, modify), streams them over NATS, and renders a live heatmap in the browser. The result is a real-time view of order flow without needing a direct market data feed.
Architecture
The system is a linear pipeline of four components, connected by NATS subjects:

- Feeder (Go): a synthetic generator that publishes little-endian binary snapshots on
orderbook.snapshots(swap in a WebSocket exchange feed if needed). - Processor (C++): subscribes to snapshots, diffs against previous state, emits granular order events to
orderbook.tbtin a compact binary format. The pairId is carried in the payload header. - Viz Server (Go): bridges NATS to WebSocket. Subscribes to
orderbook.tbt, fans out to connected browser clients. - Browser (React/Canvas): renders a scrollable, zoomable heatmap of order book depth over time.
Each component is independently deployable. The feeder and viz server are straightforward Go services; the interesting work happens in the C++ processor.
Snapshot Diffing
The processor maintains per-pair book state. On each new snapshot, it walks both the bid and ask sides comparing price levels against the previous state, emitting granular events for every change.
The core data structure is a packed 40-byte order struct:
// 20-byte header
struct Header {
    uint8_t  type;       // message type
    uint32_t pairId;
    uint64_t seq;        // sequence number
    uint32_t count;      // event count
    uint8_t  pad[3];
}; // 20 bytes

// 40-byte wire order
struct Order {
    uint32_t pairId;
    double   price;
    uint64_t time;
    double   qty;
    uint8_t  side;       // 0 = bid, 1 = ask
    uint8_t  type;       // 0 = add, 1 = remove, 2 = modify
    uint8_t  action;
    uint8_t  pad[5];
}; // 40 bytes
The critical problem in snapshot diffing is distinguishing new orders from revisited price levels. Snapshots only show current state. A price move from 20 down to 10 and back to 20 causes every level in that interval to reappear. The processor has to distinguish fresh orders from liquidity it saw before the move.
The seeker is the component responsible for this classification. It tracks which price levels the processor has previously observed and decides, for each level in a new snapshot, whether the quantity there represents new order activity or a revisit of known state.
Current Implementation: Bounds-Based
The current seeker uses a simple bounds-based strategy. It tracks the max bid and min ask seen so far as hard boundaries. Any price level within those bounds that reappears after a gap is treated as not-new, regardless of quantity. Only levels beyond the frontier are tagged as SEEKER_ADD. It still emits add/remove diffs for all changes.
This is deliberately naive. After a price sweep from 20 to 10 and back, the whole interval falls within the known bounds. The seeker discards those revisited levels from its new-activity classification. A substantial change in quantity may indicate genuine new order activity at one of those levels. The bounds-based seeker has no memory of what was at each level, only whether a level has ever been inside the observed range.
Future Work
The seeker logic is currently hardcoded into the processor. I want to make it swappable by putting the classification strategy behind an interface. That would let me test different approaches independently of the rest of the pipeline.
One direction is probabilistic quantity matching: if a revisited price level shows quantity that does not diverge significantly from its historical value, treat it as not-new. A difference beyond the threshold would be classified as new order activity for downstream processing. Other heuristics could account for time-weighted decay or use volume profiles. An ML-based classifier is another approach worth testing. No single approach is correct for all market conditions, which is exactly why making the seeker core swappable would be valuable.
The diff still walks full depth; there is no explicit scan window yet. For a typical snapshot with 200 price levels per side, activity concentrates in a narrow band, but the current implementation processes all levels.
Wire Format & Performance
Events are serialized in a minimal binary format rather than JSON or protobuf:
- Header: 20 bytes: message type (1B), pair ID (4B), sequence number (8B), event count (4B), padding (3B)
- Body: N × 40 bytes: packed Order structs, memcpy-safe
A typical update with 30 order events is 20 + (30 × 40) = 1,220 bytes on the wire, compared to ~8KB for equivalent JSON.
The processor pre-allocates vectors with reserve(256) for both sides of the book, avoiding reallocation during normal operation. The Order struct is designed to be trivially copyable. It contains no pointers and requires no heap allocations.
Google Benchmark on Apple M4 (10-core), clang 17, -O3:
-------------------------------------------------------------------------------------------------
Benchmark                                       Time             CPU   Iterations UserCounters...
-------------------------------------------------------------------------------------------------
BM_FullSnapshot/5/min_time:2.000            0.490 us        0.489 us      5789885 depth=5 items_per_second=2.04536M/s
BM_FullSnapshot/10/min_time:2.000            1.19 us         1.19 us      2371203 depth=10 items_per_second=839.731k/s
BM_FullSnapshot/20/min_time:2.000            2.94 us         2.93 us       961307 depth=20 items_per_second=341.193k/s
BM_FullSnapshot/50/min_time:2.000            9.11 us         9.08 us       311167 depth=50 items_per_second=110.125k/s
BM_FullSnapshot/100/min_time:2.000           21.8 us         21.4 us       133008 depth=100 items_per_second=46.7225k/s
BM_IncrementalUpdate/10/min_time:2.000       3.17 us         3.09 us       852642 churn%=10 items_per_second=323.248k/s
BM_IncrementalUpdate/30/min_time:2.000       3.25 us         3.21 us       861189 churn%=30 items_per_second=311.452k/s
BM_IncrementalUpdate/50/min_time:2.000       3.37 us         3.37 us       818522 churn%=50 items_per_second=297.087k/s
BM_IncrementalUpdate/70/min_time:2.000       3.48 us         3.34 us       860731 churn%=70 items_per_second=299.175k/s
BM_MarketOrder/10/min_time:2.000             26.7 ns         26.2 ns    111482276 depth=10 items_per_second=38.105M/s
BM_MarketOrder/50/min_time:2.000             26.8 ns         26.2 ns    109369019 depth=50 items_per_second=38.1242M/s
BM_MarketOrder/100/min_time:2.000            26.0 ns         26.0 ns    105656390 depth=100 items_per_second=38.4142M/s
BM_MixedWorkload/min_time:3.000             0.338 us        0.332 us     13059620 items_per_second=3.01371M/s
Incremental updates stay flat at ~3 µs regardless of churn rate. Market order processing hits 26 ns (~38M ops/s), dominated by a single lookup into the pre-sorted book. Full snapshots scale linearly with depth as expected.
Visualization
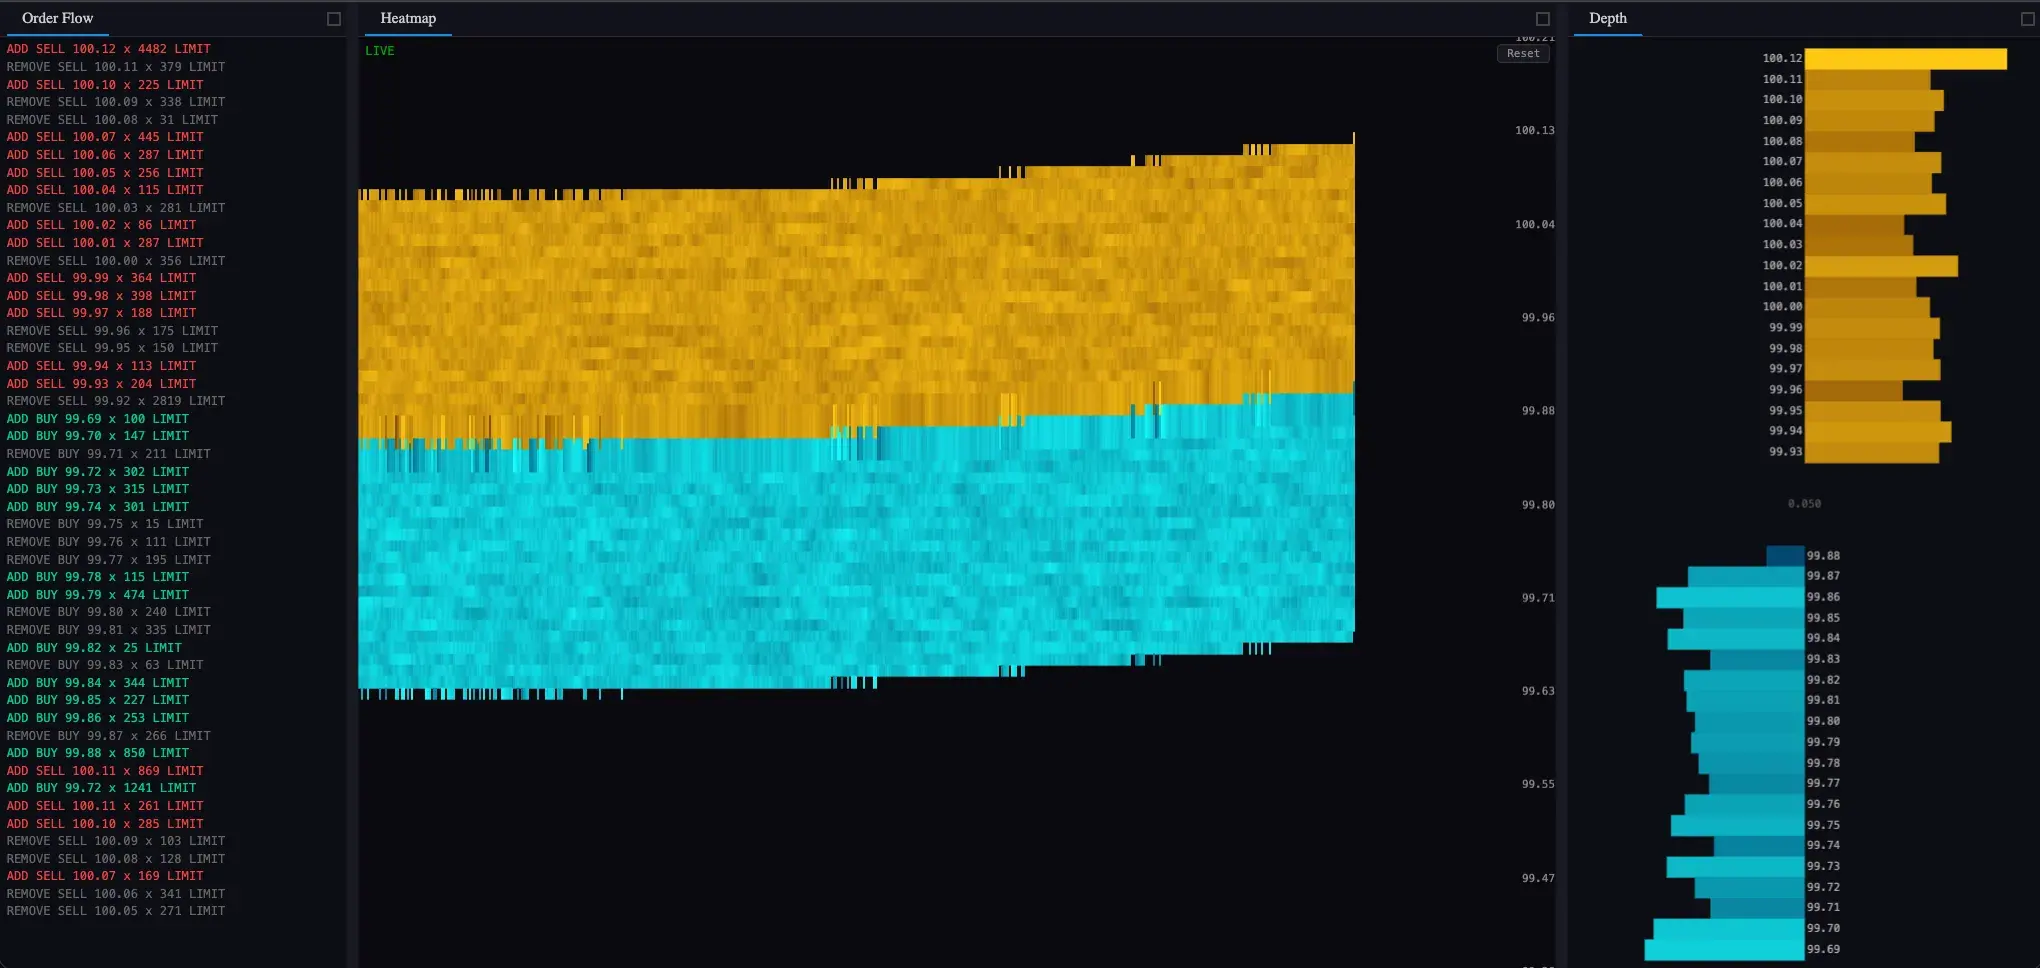
The browser client renders directly to a <canvas> element using pixel-level drawing (no charting library). Each column is a time slice, each row a price level. Pixel intensity maps to order quantity using sqrt scaling. This compresses the wide dynamic range of order sizes into a visible gradient.
Bid levels use the cyan channel; ask levels use orange. The dark gap between those bands shows the spread.
You can zoom into the viewport or pan through it. Auto-follow locks the view to the latest time slice. At typical update rates of 1-2 snapshots per second, the heatmap provides a readable view of how liquidity shifts around the spread.
Running It
Local development with Docker Compose:
docker-compose up
This starts NATS, the feeder, processor, and viz server. The UI is served on http://localhost:8080.
For a multi-node setup with Kind (Kubernetes in Docker):
cd infra && ./deploy.sh
The deploy script creates a Kind cluster with NATS installed through Helm. It then deploys the application components and configures horizontal scaling for the processor.
Source code: github.com/NagyErvin-ZY/lob-proc